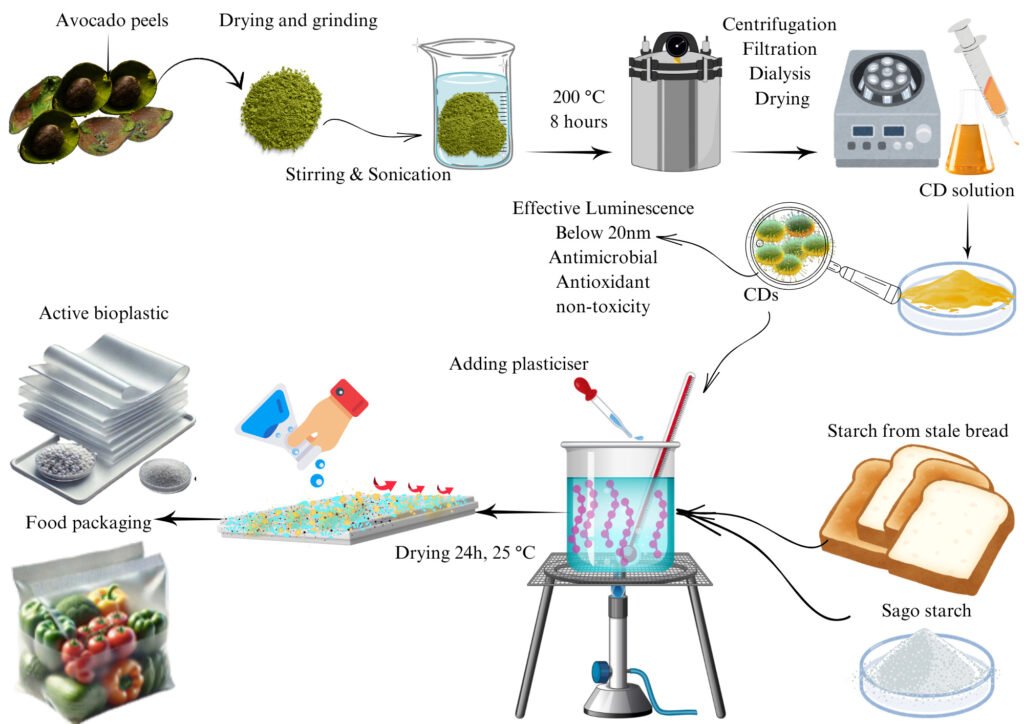
What is a Scientific Illustration?
A scientific illustration is a visual representation of scientific concepts, created with the goal of improving comprehension. These illustrations are used across disciplines such as biology, chemistry, medicine, engineering, and environmental science. Unlike artistic or abstract images, scientific illustrations are grounded in accuracy and clarity. They help explain complex ideas, support research communication, and make scientific information easier to understand for both experts and the general public. They may include:
- Molecular structures
- Medical procedures
- Anatomical drawings
- Botanical illustrations
- Infographics summarizing research findings
- Scientific equipment and processes
Why is Scientific Illustration Important?
Visuals improve retention and clarity. Research shows that people remember 80% of what they see, compared to just 10% of what they hear and 20% of what they read. This makes scientific illustrations powerful tools for sharing complex information and summarizing the study visually. They can break down technical data, highlight key concepts, and make scientific content more engaging and accessible for diverse audiences, from researchers to the general public. Scientific illustrations:
- Simplify complex data
- Enhance the clarity of research papers
- Help grant proposals stand out
- Improve educational materials
- Assist in product development presentations
- Support public science communication
In a competitive academic and commercial landscape, well-made visuals can make your work more persuasive and easier to understand. Graphical abstracts, for example, are now widely used in scientific journals to give readers a quick, visual summary of a study’s key findings—helping to boost visibility, engagement, and impact.
Difference between Scientific Illustration and Graphic Design
Scientific illustration and graphic design may both involve visual creativity, but their goals and methods are fundamentally different. Graphic designers focus on aesthetics, branding, and visual flow, aiming to capture attention and communicate broad messages. Scientific illustrators, however, are trained to convey complex concepts with precision and clarity, often combining expertise in both art and a specific field of study—be it engineering, environmental science, medicine, physics, or even management. Their role is not just to make visuals look appealing, but to ensure that technical information is interpreted accurately and communicated in a way that enhances understanding.
This distinction is especially crucial when visuals are used in research publications, technical documentation, educational resources, or grant proposals—where a well-crafted illustration can make the difference between confusion and clarity. Scientific illustrators are skilled at visualizing processes, data, and ideas that can’t be easily photographed or explained in words alone. For science-driven projects where accuracy, comprehension, and credibility matter, working with a scientific illustrator offers a distinct advantage.
We’re a team of scientists and illustrators dedicated to bringing your work to life—visually compelling, scientifically accurate, and tailored to your field.
Check Out Our Sample Works
Best Software for Scientific Illustration
2D Illustration Tools
Adobe Illustrator – Professional vector graphics (scalable, high-quality). Paid
Inkscape – Open-source alternative to Illustrator. Free
VectorStock – Library of editable vector images. Paid
Mind the Graph – Drag-and-drop scientific infographics. Paid
BioRender – Life sciences illustrations tool. Paid
Sketchbook – Freehand drawing tool by Adobe. Best with tablets. Free
Krita – Free alternative to Sketchbook. Free
3D Illustration Tools
Maya + Molecular Maya – Pro-level 3D + molecular modeling. Paid / Free add-ons
Blender + BioBlender – Open-source 3D with molecular plug-ins. Free
Solid Edge, 3ds Max – advanced but expensive. Paid
Diagram & Infographic Tools
Adobe InDesign – Professional layouts and posters. Paid
Microsoft Publisher – Easier, MS Office-style design. Paid
PowerPoint – Surprisingly effective for diagrams/posters. Paid
Visio – Best for flowcharts/technical diagrams. Paid
Canva – Stylish templates, very user-friendly. Free / Paid
Piktochart – Infographics and presentation tool. Paid
Image Editing & Analysis
ImageJ – Advanced image analysis. NIH-developed. Free
Photoshop – Pro image editing. Disclose edits in science. Paid
GIMP – Free Photoshop alternative. Free
Free Scientific Illustrations
NOA – Open-access journal image search
PDB-101 – Molecular biology images
Creative Commons – Reusable media search
Unsplash / Pexels – Free high-quality photos and videos
Outsource Your Scientific Illustration
